In 2017, the Netherlands collected 1,990 kt of plastic waste. Lobelle et al. (2024) produced the first complete material flow analysis — where it came from, where it went, and how much leaked into the environment. Here is what we know.
Estimated annual leakage abroad — plastic that left the Netherlands and ended up in rivers, land or ocean in destination countries. The 5× range reflects the absence of direct measurement.
Domestic land and water leakage — the plastic that stayed in the Netherlands. A 40× uncertainty range because land litter is counted by item, never by mass.
A quarter of all Dutch plastic waste left the country. After Rotterdam, Dutch law stopped tracking it. UN Comtrade records the shipment — not what happens next.
Navarre et al. (2022) narrowed the lens to one sector — food packaging — and traced its full lifecycle. Their finding is the single most consequential number in the Dutch dataset.
The Dutch food sector generates 296 kt of plastic packaging annually. Of this, 6.5 kt per year reaches the marine environment. That is a 2.1% marine leakage rate — not exceptional by European standards, but not better than the global average either.
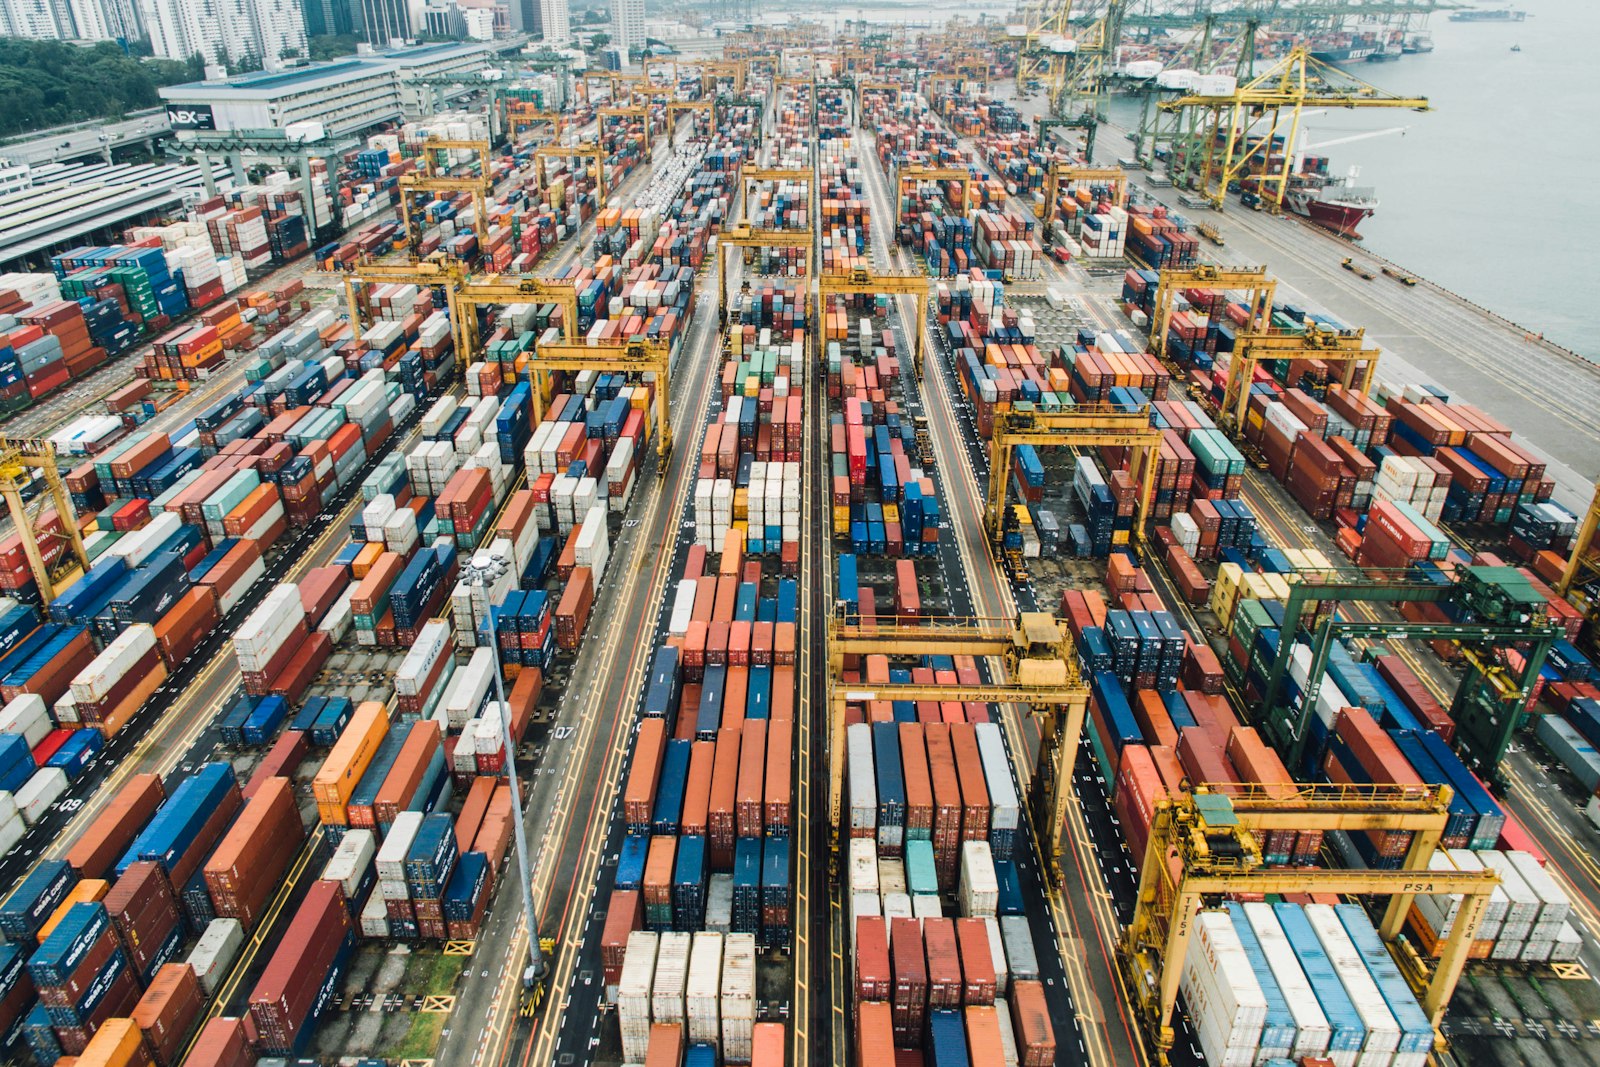
The routing matters: 75% of that 6.5 kt does not spill from a Dutch roadside or float down a Dutch river. It leaks after export — in processing facilities in Indonesia, Malaysia, Vietnam, Turkey and India — from packaging labelled in Dutch, certified in the Netherlands, counted as recycled in Dutch statistics.
A plastic sorting facility. Once material leaves here as a certified export, Dutch reporting chains consider the job done. What happens in the destination country is largely unknown.
Between 2017 and 2019, trained volunteers sampled 152,415 litter items at 212 unique locations along the Dutch Rhine–Meuse delta using the River-OSPAR protocol. A follow-up study in 2021 measured floating plastic transport at 26 locations across the Rhine, IJssel and Meuse.
On the riverbanks, foam, hard and soft plastic fragments dominated — 55.8% of all items. The most abundant specific items were plastic bottles, food wrappings, caps, lids and cotton swabs. 85.1% of all items were identified as plastic. Litter density was higher in spring (2,430 items/km) than in autumn (1,060 items/km), driven by preceding peaks in river discharge that mobilise accumulated plastic from riverbanks.
The Netherlands reports a 78% recycle rate of packaging waste (Eurostat, 2021), and Lobelle et al. (2024) estimates a 33% overall plastic recycling rate — roughly four times the global average of 9% (Geyer et al. 2017). On paper, a model for Europe. In practice, Dutch food packaging leaks to the marine environment at globally average rates.
The explanation lies in what the recycling rate actually measures. Once material leaves as a certified export, it is counted as recycled. But a substantial share of those exports reaches Asian countries, where open dumping rates exceed 20%. The plastic counted as recycled in Amsterdam ends up in an Asian river.
Navarre et al. (2022) traced the Dutch food packaging stream specifically: of 296 kt processed annually, 6.5 kt per year reaches the marine environment. Three-quarters of that leakage — 78% — occurs not from Dutch roadsides or rivers, but from the recycling export chain. Material certified in the Netherlands, labelled in Dutch, counted as recycled, and leaking into the Pacific.
The Netherlands also imports roughly 18.5% of the world's plastic waste — despite having only 0.24% of the world's population (Fair Resource Foundation 2025). Much of this imported scrap is re-exported after sorting. Its ultimate fate is unknown. The country's position as the world's largest per-capita plastic waste importer adds a further layer of transboundary responsibility that domestic statistics do not capture.
Despite a high recycling rate, Dutch marine leakage per tonne of food packaging is indistinguishable from the world average (Navarre et al. 2022).
Three-quarters of Dutch marine leakage does not come from domestic littering — it leaks after export, in countries where waste management is inadequate. Navarre et al. 2022.
The Netherlands receives nearly a fifth of all global plastic waste imports. Source, treatment and fate of this material are largely unrecorded. Fair Resource Foundation 2025.
A single financial incentive changed behaviour faster than any awareness campaign. The Dutch deposit return system is the cleanest causal signal in the dataset.
On 1 July 2021 the Netherlands introduced a €0.15 deposit on small PET bottles (between 0.25 L and 3 L) following an EU directive requiring member states to achieve a 77% collection rate for PET bottles by 2025. In January 2023, aluminium cans were added to the DRS scope under the same legislation.
Achieved in 2024, meeting the EU target one year ahead of the 2025 deadline. Verpact annual report 2024.
Deposit of €0.15 on PET bottles between 0.25 L and 3 L. Replaces the voluntary EPR scheme that had been in place since 2003 was abandoned.
Deposit extended to aluminium cans. Both phases mandated by the EU Single-Use Plastics Directive (EU 2019/904).
Reduction in plastic bottle litter · Q4 2021 vs Q4 2020 · Zwerfinator citizen-science database, Purmerend baseline · zwerfinator.nl
Reduction in all deposit-eligible containers (bottles + cans) vs 2020 baseline · after cans joined DRS January 2023 · Verpact annual report 2024
Taken together, these gaps mean that a significant fraction of Dutch plastic environmental impact is structurally invisible to the people responsible for managing it.